
South Durham Schools Post Gains, but Results Remain Uneven
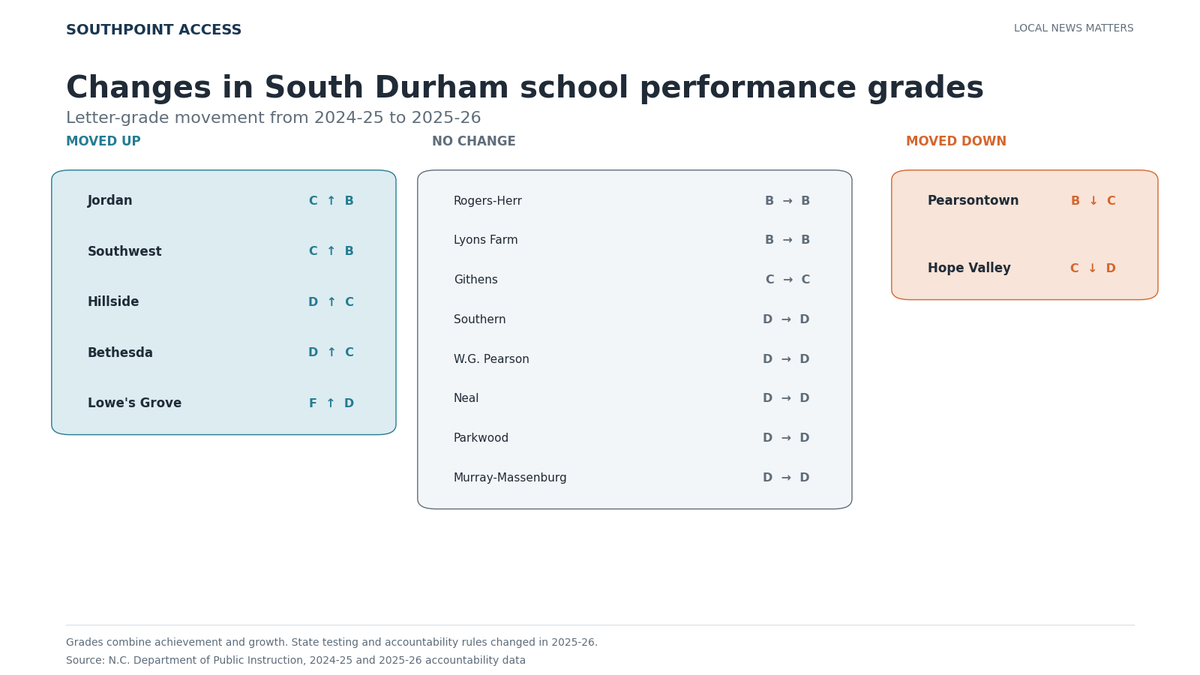
Jordan High School and Southwest Elementary climbed to B performance grades, while Hope Valley Elementary, Pearsontown, and several other South Durham schools faced setbacks in North Carolina's newly released accountability results.

 Wes Platt
Jordan High School and Southwest Elementary emerged as two bright spots for South Durham in the 2025-26 school accountability results, with both schools improving from C to B performance grades.
Jordan's performance score rose from 67 to 70. Proficient test results increased 6.4 percentage points to 57.9%, while the college and career ready percentage rose 8.4 points to 41.2%.
Southwest's proficiency rate climbed 6.7 points to 69.8%, lifting its performance score from 68 to 72.
Lowe’s Grove Middle also saw notable improvement. Grade-level proficiency rose 11.7 percentage points, from 24.1% to 35.8%, and the school exceeded expected academic growth. Its performance score increased from 34 to 46, moving its grade from F to D.
But the picture wasn't uniformly positive across South Durham. Hope Valley Elementary fell from C to D, joining North Carolina's list of low-performing schools. Pearsontown Elementary dropped from B to C after its proficiency rate declined and the school failed to meet expected academic growth.
Murray-Massenburg Elementary fell short with expected growth, remaining a D and low-performing school during its second year. Other D schools in the area included Southern School of Energy and Sustainability, Neal Middle, Parkwood Elementary, and W.G. Pearson Elementary.
District-wide, however, Durham Public Schools found reason to celebrate, as overall proficiency rose 4.8 percentage points to 53.2%. Forty-five schools recorded proficiency gains, and no DPS school received an F for the first time since North Carolina began assigning school performance grades in 2014.
"We are extremely pleased with the outstanding results," said Superintendent Dr. Anthony Lewis in a news release.


![[SoDu We Grow] Two projects leave the list as South Durham’s development calendar fills up](https://storage.ghost.io/c/50/33/50334374-93a7-4cf9-ba69-d7d51c63be2a/content/images/size/w600/2026/10/grow101-1.png)
![[SoDu We Dine] Two restaurants gain 6 points in latest South Durham inspection update](https://storage.ghost.io/c/50/33/50334374-93a7-4cf9-ba69-d7d51c63be2a/content/images/size/w600/2026/10/diningguide829.png)
![[SoDu We Take a Break] All treats, no tricks](https://storage.ghost.io/c/50/33/50334374-93a7-4cf9-ba69-d7d51c63be2a/content/images/size/w600/2026/10/takeabreak1021.png)
![[SoDu We Work] Holiday work, school programs, and utilities jobs](https://storage.ghost.io/c/50/33/50334374-93a7-4cf9-ba69-d7d51c63be2a/content/images/size/w600/2026/10/jobsguide829.png)